Power proportional computing
1. Introduction
This post illustrates the relationship between power consumption, CPU load,
and CPU frequency of a laptop computer. The subsequent analysis is based on a
dataset collected from a 13-inch Macbook Pro running on a Core i5-5287U processor
with MacOS Seirra installed.
The dataset consists of two data frames populated with the following readings:
| Column | Desciption |
|---|---|
| Time | Sample time stamp |
| Voltage | Voltage reading of the battery (in mV) |
| Current | Current reading of the battry (in mA) |
| Remaining charge | Remaining charge of the battery in (mAh) |
| CPU load | CPU load in (%) |
| Total power consumption | Power consumption (in Watts) computed using P = V*I where V and I are obtained from the Voltage and Current columns |
| Processor power consumption* | Power consumption of the processor, i.e., Total power - processor power = pwr cons. of other components |
| Processor speed (freq)* | processor clock frequency (in MHz) at sampling instance |
* Data collected using Intel Power Gadget.
Tools used:
MacOS SystemProfiler: to collect battery discharge info., i.e.,
voltage and current readings.
Intel Power Gadget: CPU frequency and power consumption monitoring tool
Python Libraries
psutil: to gather CPU load at user-defined sampling intervals
pandas and numpy: to process the resulting data
bokeh: for plotting
Aditionally, I had to write a small python program to automate the data collection.
Finally, for anyone interested, the data and associated code lives here.
2. Energy efficiency
Energy efficiency is a vital factor to consider in the design of modern computer systems. Some of the top energy consumers in a laptop are CPU, LCD, RAM, GPU, and disk, with the most power hungry component being the CPU.
CPU power consumption
Power consumption of a CPU is usually modeled by the proportionality,
where V is the supply voltage to the CPU and f is the clock frequency in Hz. However, clock frequency is also proportional to supply voltage, i.e,
yeilding a cubic relatioinship between power consumption (P) and clock frequency (f). However, lower degrees of proportionality may often emerge as there are several factors affecting the proportionality. Generally,
where the proportionality exponent a is in the range (1, 3).
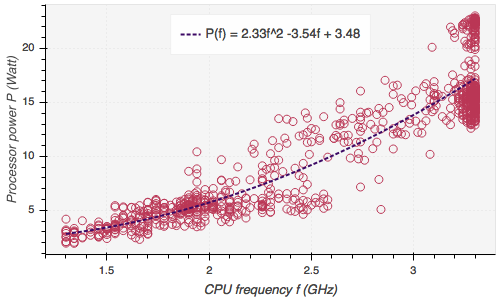
Let us illustrate this proportionality using the empirical data described in the Introduction. The following figure shows a scatter plot of CPU power consumption as a function of CPU clock frequency. The dotted line is a polynomial curve fitting of the data resulting in a quadratic relationship between power and frequency (i.e. a=2 in the above proportionality equation),

Speed scaling
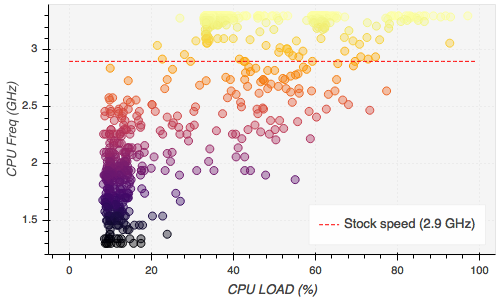
As shown in the above figure, the CPU operates at a range of frequencies, 1.3 GHz to 3.3 GHz, instead of operating at the advertised stock frequency, which is at 2.9 GHz for the particular CPU model under consideration. This is for the laptop’s own good. When high speed is not needed, the CPU saves battery power by operating at lower frequency.
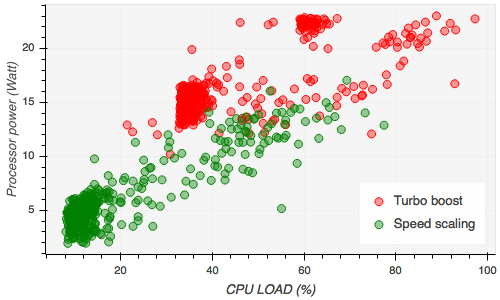
Being the heart of a computer, the CPU also imitates how the heart operates, sort of. Just like our heart starts pumping more blood when we start running or when we engage with some other demanding task, the CPU can vary the clock frequency depending on the amount of workload. This mechanism is called speed scaling or speed step when the range of frequency is between the lowest and the stock frequency, and turbo boost for frequencies in between the stock frequency and the max frequency. The following figure illustrates this phenomenon using the data collected from the computer under study.

There is a claim that turbo boost is just speed scaling rebranded for marketing purpose. However, this paper concisely described turbo boost as the performance improvement gained by pushing the CPU beyond its Thermal Design Point (TDP) for short periods of time. Since the long run average power cannot exceed the TDP, turbo boost cannot be sustained for a long period, and is made possible by the thermal budget accumulated during less demanding periods.

Total power vs CPU power
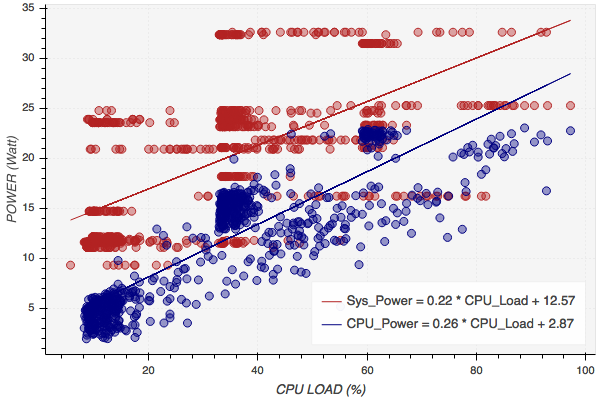
Obviously, the CPU is not the only component that consumes power. A computer’s total power consumption can still be high when the load on the CPU is low. For example, streaming high definition video from youtube will keep the GPU and the LCD display busy without having a significant impact on CPU load. Another example can be an input/output intensive task that frequently reads and writes to disk that requires CPU time only occasionally. The following scatter plot illustrates both the total system power consumption and CPU power consumption. A linear approximation of system and CPU power as a function of CPU load is also given in the same figure.

According to the linear approximation, the system and CPU power consumptions when the CPU is idle are around 12 and 3 Watt, respectively. At 100% CPU load, system and CPU power would be around 35 and 28 Watt, respectively. Over the entire load spectrum, the gap between the two lines represents power consumed by components other than the CPU. Note also that the gap gets narrower as the CPU load increases. This is intuitive since the CPU takes the lion’s share of power at higher load.