Exploratory Data Analysis: Capturing and analyzing internet traffic
This notebook shows how to capture and analyze network traffic on a computer connected to the internet or a local area network. Wireshark is a powerful tool to capture IP packets going in/out of the network card of a computer. By default, Wireshark captures packets destined to the host computer. Performing network-wide capture is also possible by toggling the promiscuous and/or monitor mode, see this tutorial. In this demo, we focus on network traffic generated by a single machine (my computer).
To automate the capturing process, Tshark, a version of Wireshark that can be run on a terminal window is used. The captured data is saved in a csv format, and analyzed using scientific libraries of python. In summary, the tools required for this demo are:
This post uses Tshark (a command line network traffic capturing tool), Shell script (to automate the capture in Linux or Mac) and Python (for scripting, analysis, visualization)
Lets begin with importing python libraries needed for data analysis
import numpy as np
import pandas as pd
from matplotlib import pyplot as plt
import seaborn as sns
import os
import prettypandas
%matplotlib notebook
… and adjusting display setting
sns.set_style('whitegrid')
sns.set_style({ 'grid.color': '0.8','grid.linestyle': u'--',})
sns.set_palette('RdBu_r')
Setting up the capture
Instead of performing one long capture, I have chosen to divide the captures into one hour long intervals. Traffic data from each of these intervals is saved into a separate file. The capture starts at 1pm and ends at 12am. So we should expect 11 files in the capture folder. Here is the bash script:
#!/bin/bash

t=$(date -j -f "%a %b %d %T %Z %Y" "`date`" "+%s")
tshark -t r -a duration:3599 -e frame.time_relative -e ip.src -e tcp.srcport -e udp.srcport -e ip.dst -e tcp.dstport -e udp.dstport -e frame.len -T fields -E header=y -E separator=, >> Directory/${t}.csv
The first line retrieves the date in date-time format and converts it into Unix time. When this script is run, it starts the tshark program setting the duration option to $3599$ seconds to capture network traffic for one hour. Next follows an array of arguments telling tshark which columns to include. More detailed options and description on tshark can be found here. At the end of the script, “Directory” should be replaced by a proper directory for the output.
There are a number of ways to divide the capture into smaller chunks.
-
Write a script to run tshark for a fixed interval (say an hour), and use the crontab job scheduler to run the script periodically (esp. for Linux Mac).
-
Using the -b option of tshark
In this demo, the first option is used.
Let us now list the files in the capture folder
%ls

    1483873200.csv       1483887600.csv       1483909200.csv
    1483876800.csv       1483898400.csv       TraceAnalysis.ipynb
    1483880400.csv       1483902000.csv       periodic-tshark.sh
    1483884000.csv       1483905600.csv
In addition to the periodic-tshark.sh file, which is the script discussed above, there are 9 csv files. Each containing meta data on one hour long traffic. The file names are Unix timestamp of the first second in the corresponding hour. So lets change the first and last csv filenames to a human readable time…
import datetime
print(
    datetime.datetime.fromtimestamp(
        1483873200
    ).strftime('%Y-%m-%d %H:%M:%S')
)
2017-01-08 13:00:00
print(
    datetime.datetime.fromtimestamp(
        1483909200
    ).strftime('%Y-%m-%d %H:%M:%S')
)
2017-01-08 23:00:00
Notice that eventhough the capture spanned 11 hours there are only 9 files. The missing files are $1483891200$ and $1483894800$ or in datetime format…
print(
    datetime.datetime.fromtimestamp(
        1483891200
    ).strftime('%Y-%m-%d %H:%M:%S')
)
print(
    datetime.datetime.fromtimestamp(
        1483894800
    ).strftime('%Y-%m-%d %H:%M:%S')
)
2017-01-08 18:00:00
2017-01-08 19:00:00
From 6pm to 8pm the computer was not connected, hence, no internet traffic data collected.
Loading the data…
cols = ["frame.time_relative","ip.src","tcp.srcport","udp.srcport","ip.dst","tcp.dstport","udp.dstport","frame.len"]

tp = {"frame.time_relative":float,"ip.src":str,"tcp.srcport":str,"udp.srcport":str,"ip.dst":str,
      "tcp.dstport":str,"udp.dstport":str,"frame.len":float}
names = {"frame.time_relative":"Time", "ip.src":"Source IP", "tcp.srcport":"Source Port(TCP)",
         "udp.srcport":"Source Port (UDP)", "ip.dst":"Destination IP", "tcp.dstport":"Destination Port(TCP)",
         "udp.dstport":"Destination Port (UDP)", "frame.len":"Packet Length (Bytes)"}

def load_trace(hour):
    df = pd.read_csv(str(hour)+".csv",usecols=cols, dtype=tp)
    df.rename(columns=names, inplace=True)
    df["Time"]=df.Time.apply(lambda x: '%.6f' % (x + hour))
    return df
start = 1483873200
df = load_trace(start)
for i in range(1,11):
if os.path.isfile(str(start + 3600*i) + '.csv'):
df = df.append(load_trace(start + 3600*i))
df[3:6]

The DataFrame has 8 Columns:
-
Time: packet tx/rx time in micro second precision,
- Source IP: Internet address of the sending machine
- Source Port (TCP): TCP port of the application sending the packet (if TCP is used)
- Source Port (UDP): UDP port of the application sending the packet (if UDP is used)
- Destination Port (TCP): TCP port of the application receiving the packet (if TCP is used)
- Destination Port (UDP): UDP port of the application receiving the packet (if UDP is used)
- Packet Length (Bytes): size of the packet in bytes
Addresses and port numbers, and the size of the captured packet in bytes.
Traffic volume
Traffic per hour
One of the first things to do would be to visualize the traffic volume in different time scales. Below is the aggregate traffic volume per hour.
per_hr = pd.DataFrame(columns=["Hour", "Traffic"])
per_hr["Hour"] = df.Time.apply(lambda x: int((float(x)-1483873200)//3600))
per_hr["Traffic"] = df["Packet Length (Bytes)"]
per_hr = per_hr.append([{"Hour":5, "Traffic": 0},{"Hour":6, "Traffic":0}],ignore_index=True)
p=per_hr.groupby("Hour",as_index=False).agg({"Traffic": [np.sum]})

p.Traffic = p.Traffic.apply(lambda x: x/1000000)
fig = plt.figure()
ax = fig.add_subplot(111)

ax.plot(p.Hour, p.Traffic, 'o--')
ax.set_xlabel("Hours (since the start of capture)")
ax.set_ylabel("Traffic volume (MegaBytes)")
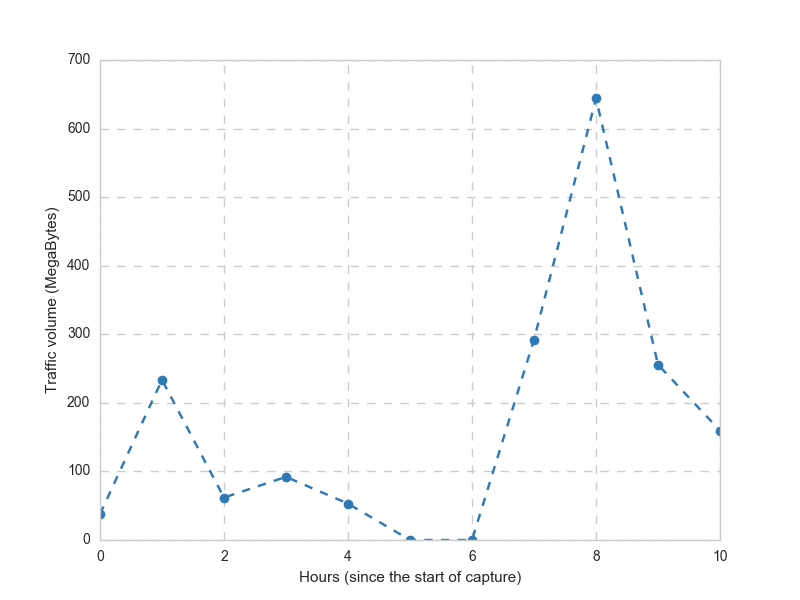
The peak occured at the 8th hour. Recalling that the capture is started at 13:00, the peak would be at 21-22, when, of course, I started streaming a movie :)
Note that there is no traffic on the 5th and 6th hours.
Traffic per Minute
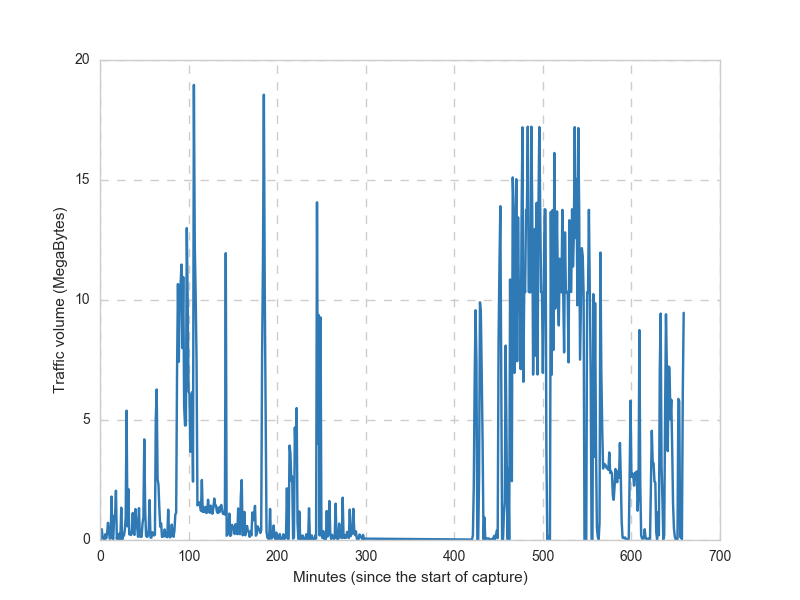
The following plot shows the traffic volume per minute in Mega Bytes
per_min = pd.DataFrame(columns=["Minute", "Traffic"])
per_min["Minute"] = df.Time.apply(lambda x: int((float(x)-1483873200)//60))
per_min["Traffic"] = df["Packet Length (Bytes)"]
p=per_min.groupby("Minute",as_index=False).agg({"Traffic": [np.sum]})
p.Traffic = p.Traffic.apply(lambda x: x/1000000)
fig = plt.figure()
ax = fig.add_subplot(111)

ax.plot(p.Minute, p.Traffic)
ax.set_xlabel("Minutes (since the start of capture)")
ax.set_ylabel("Traffic volume (MegaBytes)")
Aggregate traffic
This section wouldn’t be complete without a single number summarizing the aggregate traffic volume…
The amount of data sent/received during the entire 11 hour interval is:
print(sum(df.fillna(0)["Packet Length (Bytes)"])/1000000000, "GB")
1.829809724 GB
Packet size
Let us now have a closer look at the packet size information in the “Packet Length (Bytes)” column of the DataFrame.
df.boxplot(column="Packet Length (Bytes)", return_type='axes')
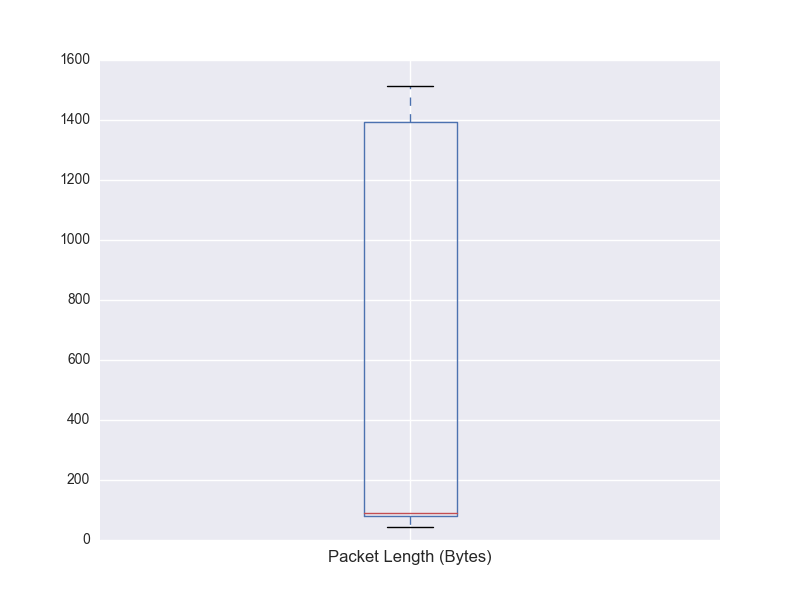
The Box plot shows that the packets range from $10$s to $1500$ bytes.
This is to be expected as the maximum allowable size (MTU)
over Ethernet is 1500 bytes. The red horizontal line around 100 bytes represents the median size.
This post discusses the queueing effect of large packets and the trade-off involved in having large packets (which induces queueing delay) and small packets (which increases per packet processing workload on the network stack).
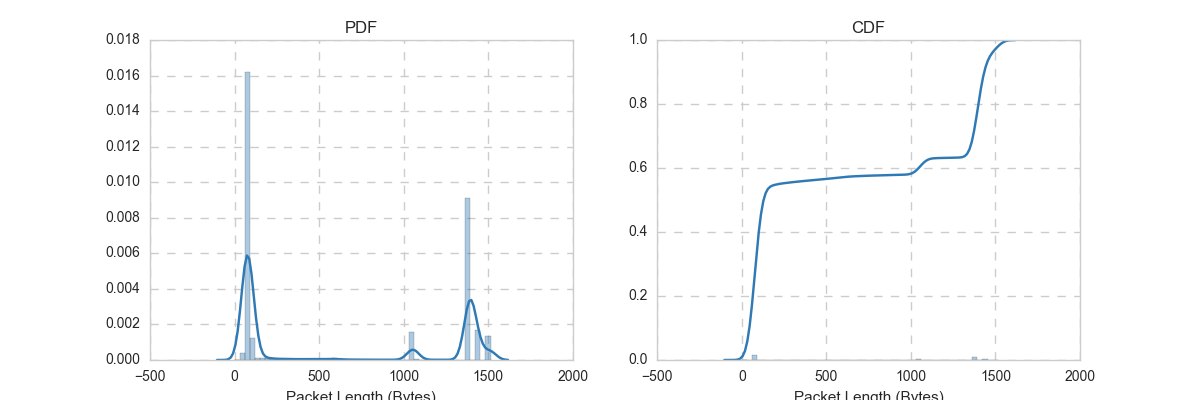
The following plots depict the PDF and CDF of packet length distribution. The CDF plot shows that about $40\%$ of the packets have size larger than $1000$ bytes.
#f, axes = plt.subplots(1, 2,figsize=(10, 5))

f, (ax1, ax2) = plt.subplots(1, 2,figsize=(12, 4))

sns.distplot(df.fillna(0)["Packet Length (Bytes)"], ax=ax1)
sns.distplot(df.fillna(0)["Packet Length (Bytes)"], ax=ax2, kde_kws=dict(cumulative=True))
ax1.set_title("PDF")
ax2.set_title("CDF")
Finding the culprit
Another interesting thing would be to see how much traffic is generated by each website (or application in general). Applications are identified by IP and/or port number. To do this, we need to plot aggregate traffic volume per source-destination-IP pair. However, in this case it suffices to calculate the aggregate traffic per source IP since the capture is performed on a computer, not on a network element (like a router).
As expected, the traffic per application has a heavy tailed distribution. The bar chart below shows the top 20 IP addresses by traffic volume. IP addresses (x-axis) not shown fully as there is no point in doing so.
f, ax = plt.subplots(1, 1,figsize=(12, 6))

per_ip = df.groupby("Source IP", as_index=False).agg({"Packet Length (Bytes)":[np.sum]})

p = per_ip.sort_values(by=("Packet Length (Bytes)","sum"),ascending=False)[:20]
p["Packet Length (Bytes)","sum"] = p["Packet Length (Bytes)","sum"]/1000000
sns.barplot(p["Source IP"], p["Packet Length (Bytes)","sum"],palette="RdBu_r", ax=ax)

ax.set_xticklabels(ax.xaxis.get_majorticklabels(), rotation=45)
ax.set_ylabel("Traffic volume (MB)")
ax.set_title("Top 20 IP addresses by traffic volume")
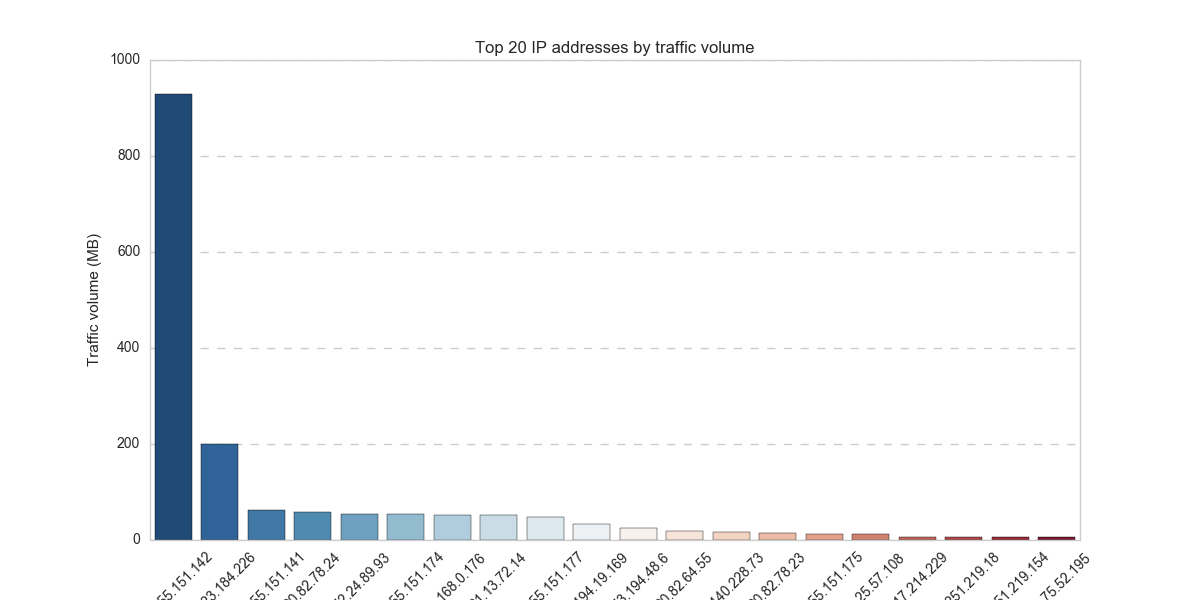
If one needs to know which application/website corresponds to which IP (or which port numbers), it can be done by listing the applications that are currently using network/internet connection using:
lsof -i
Anonymizing IP addresses
Finally, a simple way to anonymize personal data such as IP address…
df_anon = load_trace(1483873200)
anonymized['Source IP'] = df_anon['Source IP'].apply(lambda x: hash(x))
anonymized['Destination IP'] = df_anon['Destination IP'].apply(lambda x: hash(x))
anonymized.to_csv('anonymized.csv')